Our infrastructures generate a large amount of logs every day, which must be analyzed and controlled.
Over the past few months, we’ve moved our Logs collection to the Cloudwatch Logs Insights service, a fully managed service designed to work at scale.
CloudWatch Logs Insights includes a sophisticated ad-hoc query language, with commands that allow you to retrieve content quickly and accurately. Finally, it is possible to view query results in graphs, which can then be added to the CloudWatch Dashboard.
The choice to use this Amazon service was born from the need to centralize as much as possible, in a single tool, the management and analysis of the Logs, taking advantage of the excellent integration of AWS services, without too much configuration effort.
In this article we will tell you about our use case.
Logs Insights pulls data from log groups, which are used by default by many AWS services to write the output of operations, such as Lambda functions.
But we can also send the data flow of one of our applications hosted on Ec2 to a group of logs.
In this case it is necessary to install and configure Cloudwatch Agent, to send data to log groups.
Below we show you an example of Cloudwatch Agent json file configuration:
|
1 2 3 4 5 6 7 8 9 10 11 12 13 14 15 16 17 18 19 20 |
{ "agent": { "metrics_collection_interval": 60, "run_as_user": "root" }, "logs": { "logs_collected": { "files": { "collect_list": [ { "file_path": "/var/log/nginx/access.log", "log_group_name": "Nuvola/Access", "log_stream_name": "{hostname}", "timestamp_format": "%b %d %H:%M:%S" } ] } } } } |
In this example we send the log stream to Cloudwatch: /var/log/nginx/access.log.
After installing the agent, we will find, in the log groups console, the new log stream:

After a few hours that you have activated the agent, you will see the size of the logs grow more or less high (it depends on the size of your infrastructure).
Analyzing this large amount of data can be difficult, but thanks to Logs Insights we can analyze it quickly and easily.
Let’s see some examples!
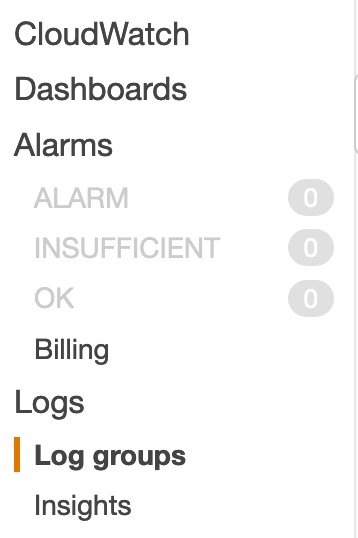
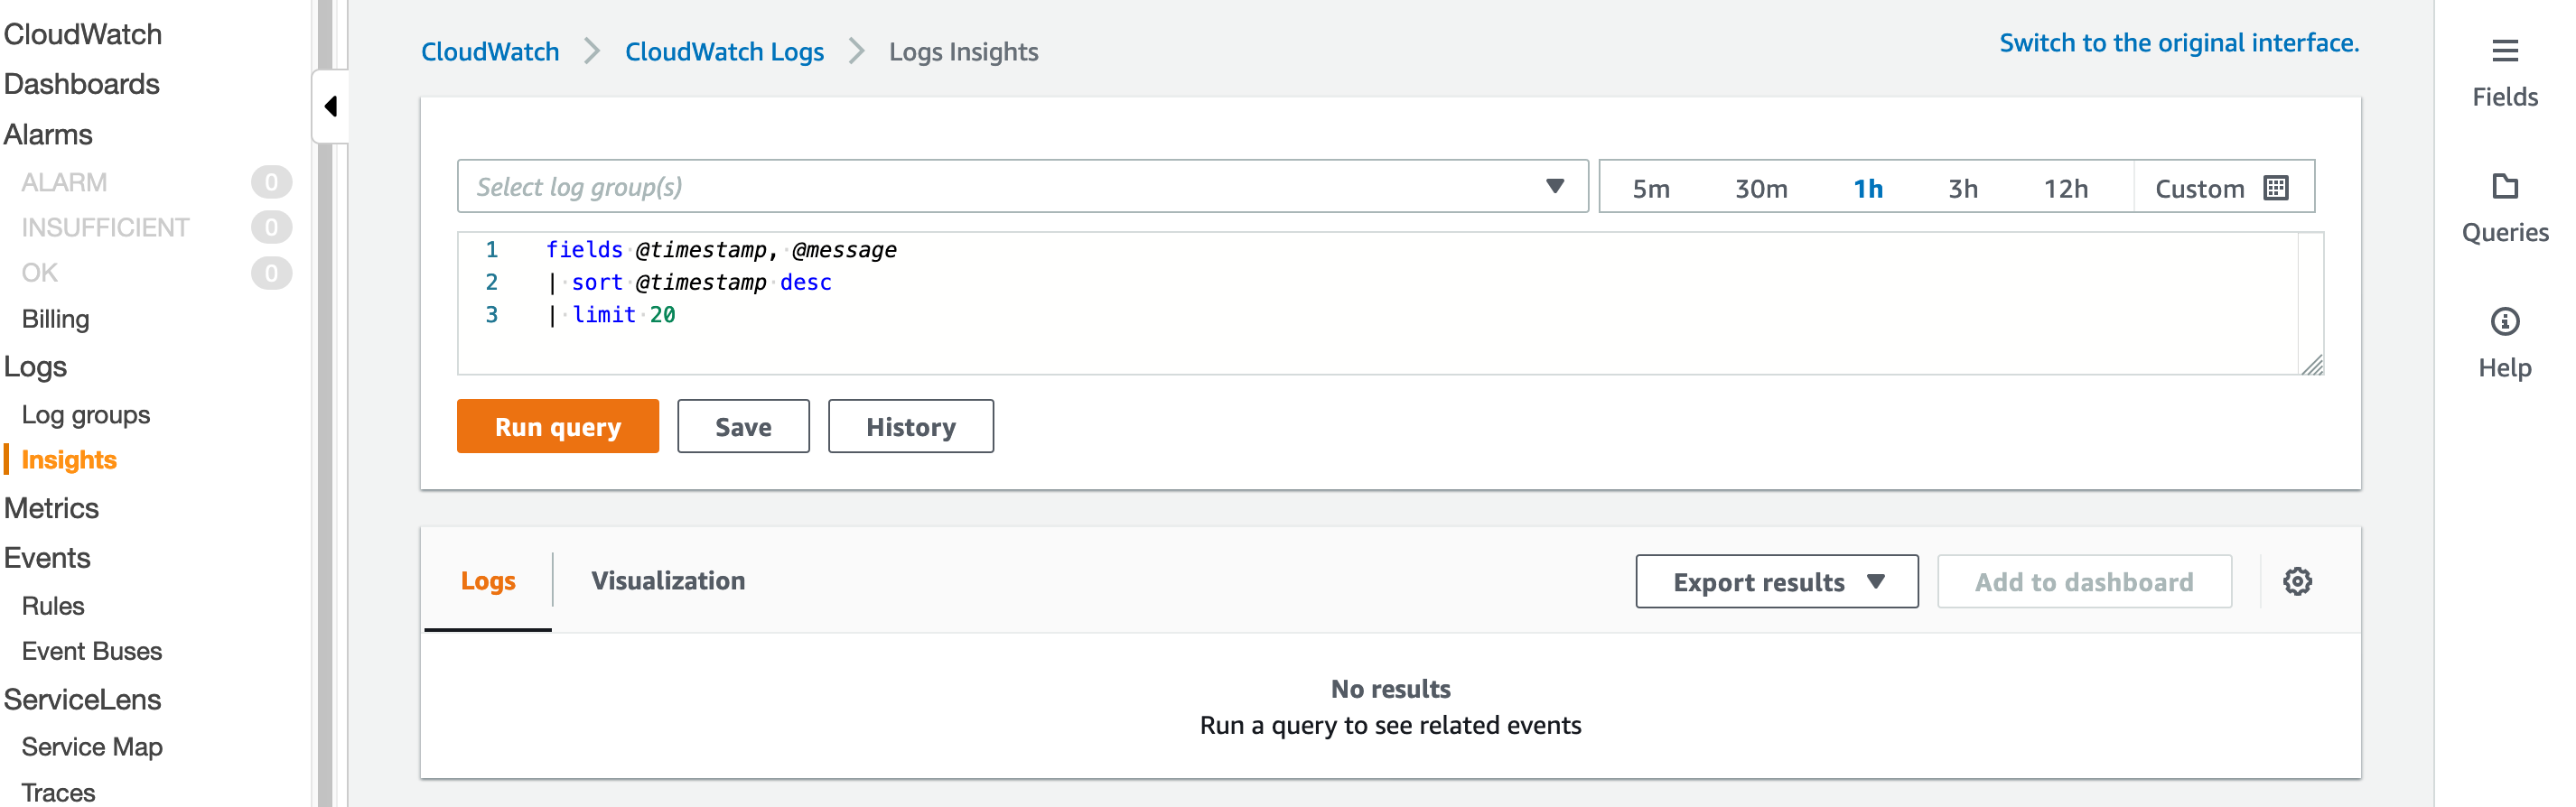
Let’s enter the Logs Insights console:
Now we want to know, in real time, the number of requests that generate 404 errors, or non-existent objects, that our application generates. Below is the query to be made on the data stream that comes to us from all our instances within the Logs Group:
|
1 2 |
fields @timestamp, @message | filter @message like / HTTP\/1.1\" 404 / |
Then, within the 2 preset fields by default, from Log Groups, let’s filter the message string:
|
1 |
/ HTTP\/1.1\" 404 / |
The output we will get will be similar to the following: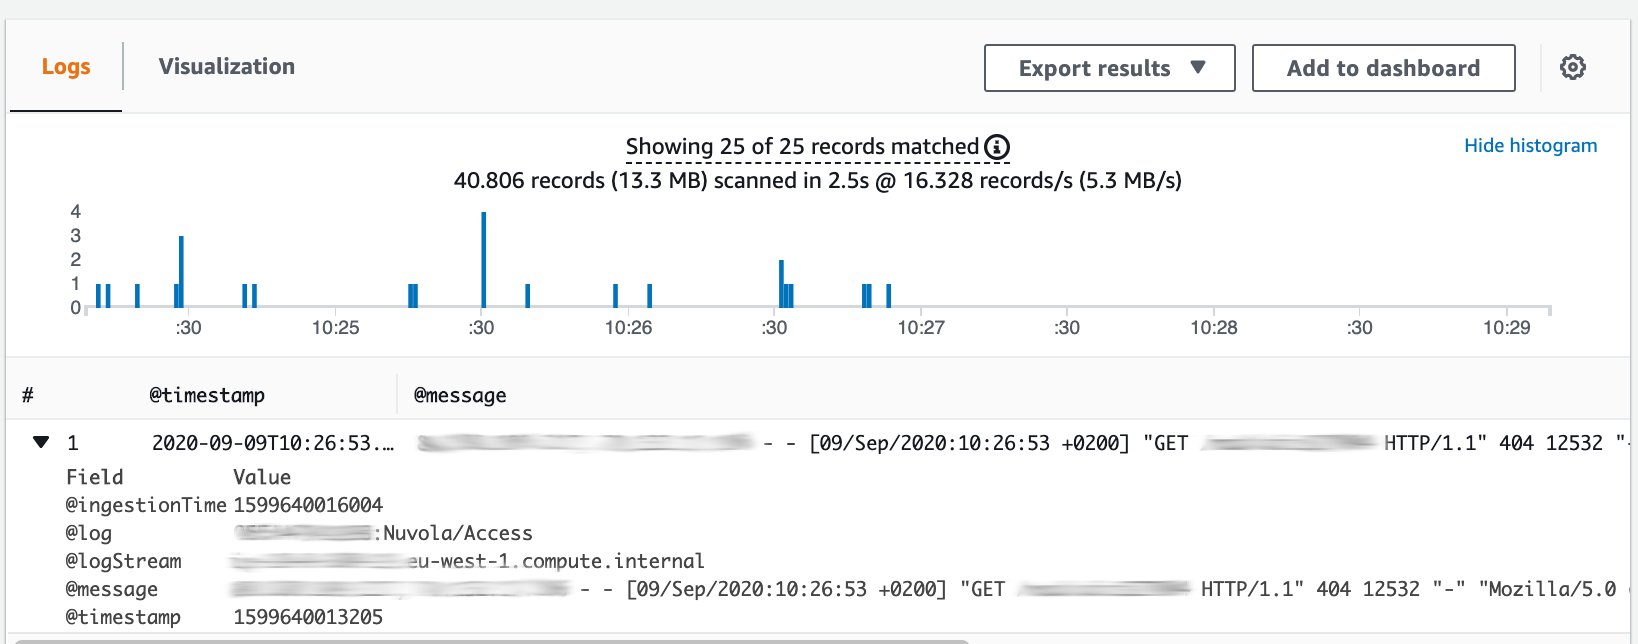
As anticipated, it is possible to create Dashboards in which to view the output of queries made with Logs Insights. Let’s see an example on how to insert a graph generated by Logs Insights into a Dashboard.
The first step is to create a query that reports the data in a format readable by Cloudwatch charts:
|
1 2 3 |
fields @timestamp, @message | filter @message like / HTTP\/1.1\" 404 / | stats count(*) as Count404 by bin(5m) |
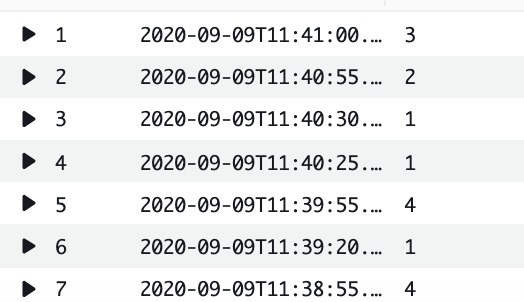
Compared to the previous query we add the stats command which allows us to calculate statistical values with respect to our data flow, and bin which rounds the values in a range of 5 minutes. The output obtained will be the following:
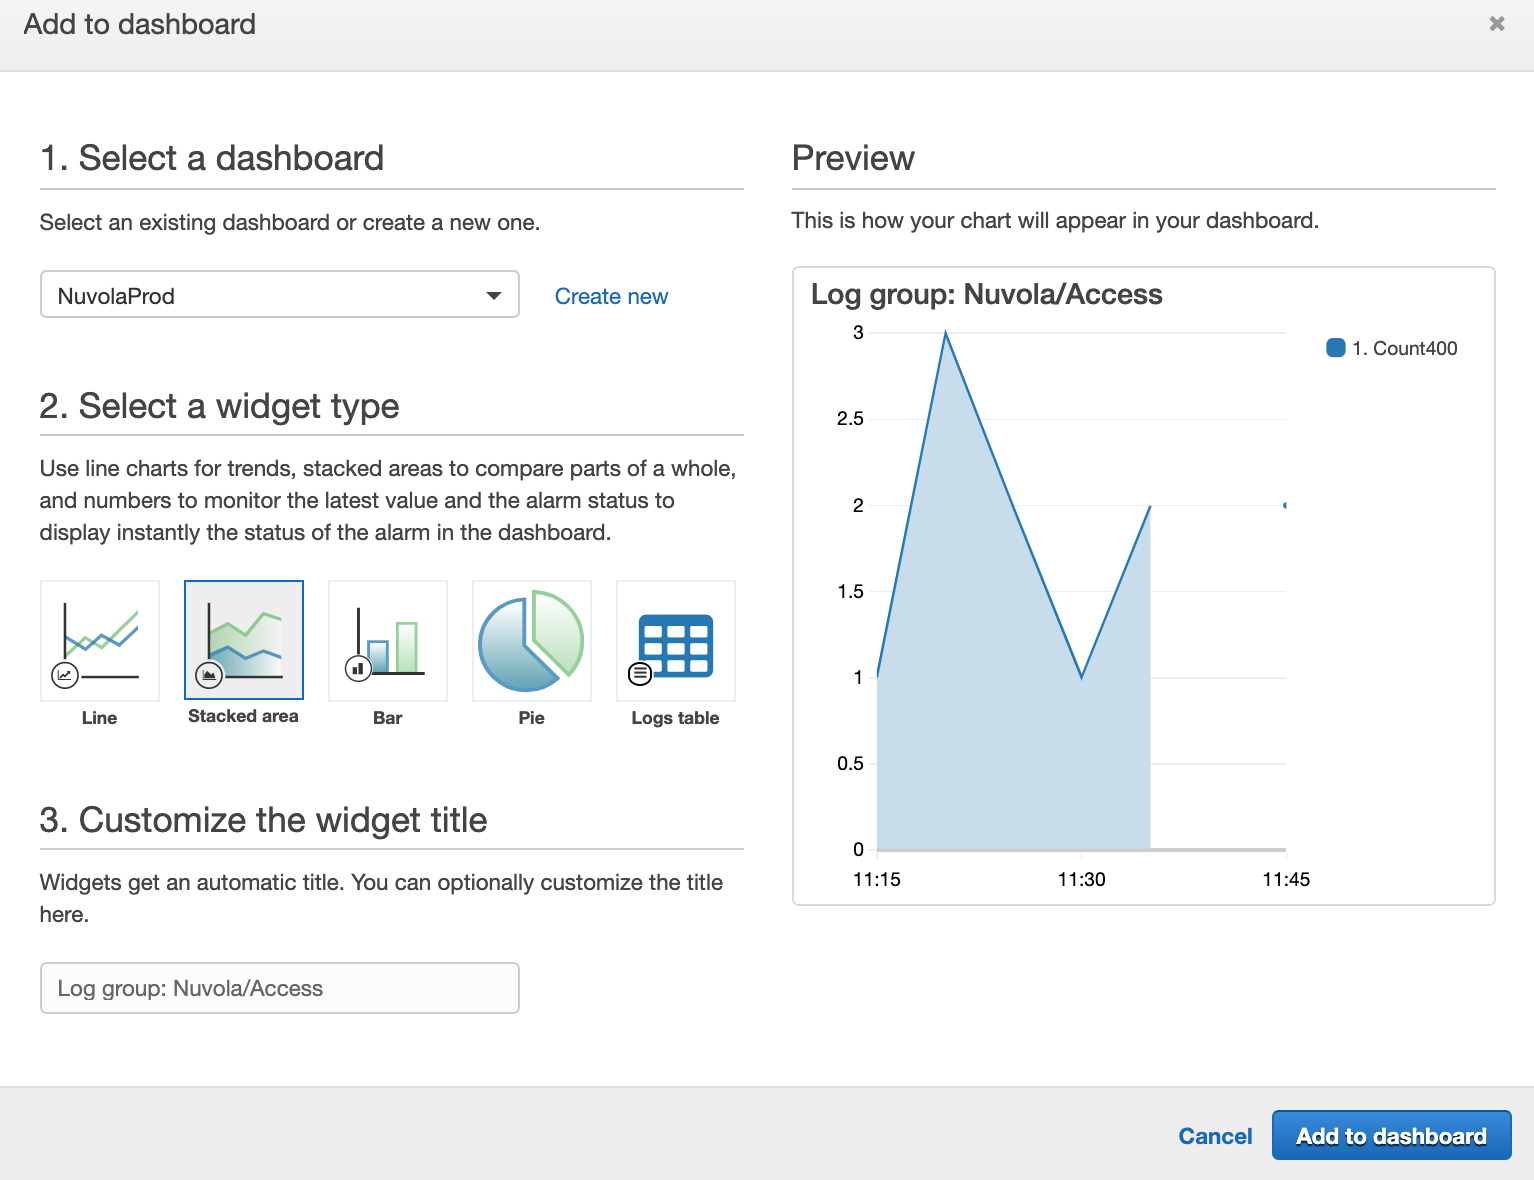
The generated output can now be inserted into a cloudwatch chart and, then, into a dashboard by clicking on “Add to dashboard” at the top right and then, in the next window, choose the type of chart that interests us:
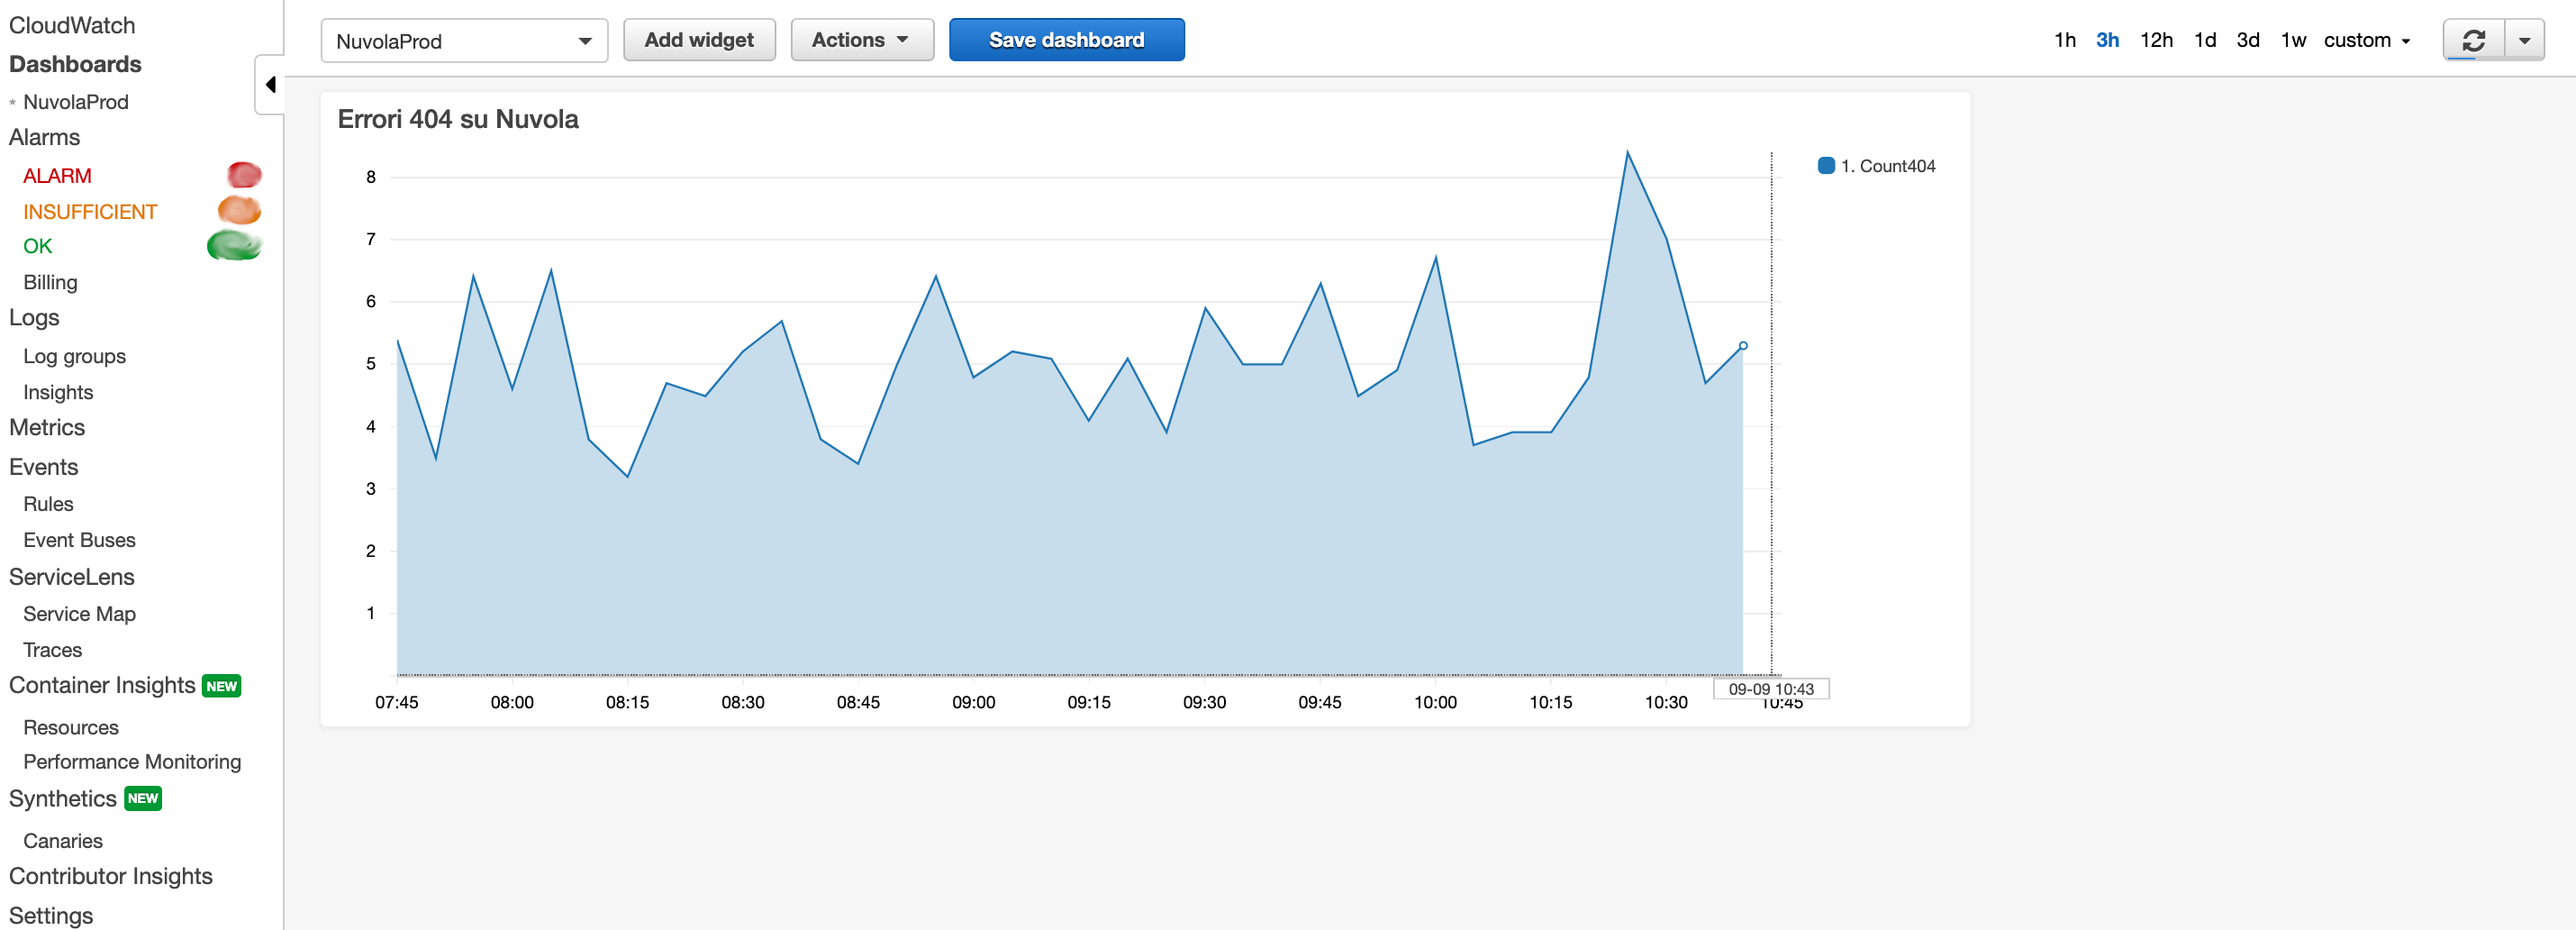
At this point we will have the graph with the 404 errors in real time in our monitoring dashboard:
As we have seen in this use case it is therefore possible to extrapolate all the information present in the Logs Group (of internal services or logs sent from external applications) through Cloudwatch Agent.
Happy Monitoring!
